flowchart TD
  U((Users Experience Issue))
  M((Metrics))
  L((Logs))
  A((Alarms))
  D((Dashboards))

  M --> A
  L --> A
  A --> D

  D -->|Early Insight| Dev((Developers / DevOps))
  Dev -->|Fix / Scale| System((System))

  System -->|Avoids Impact| U
07. Monitoring
👈 Back to: 📝 Blog | 💼 LinkedIn | ✍️ Medium
7.1 Intro to AWS CloudWatch
Why Monitoring?
- Ensuring reliable performance
- Are we using resources in a cost-effective way?
- Preventive Healthcheck: Prevent outage by scaling infra or fixing issues automated
- For security
- ❓ How do you know what’s happening inside your cloud system (before users do)?
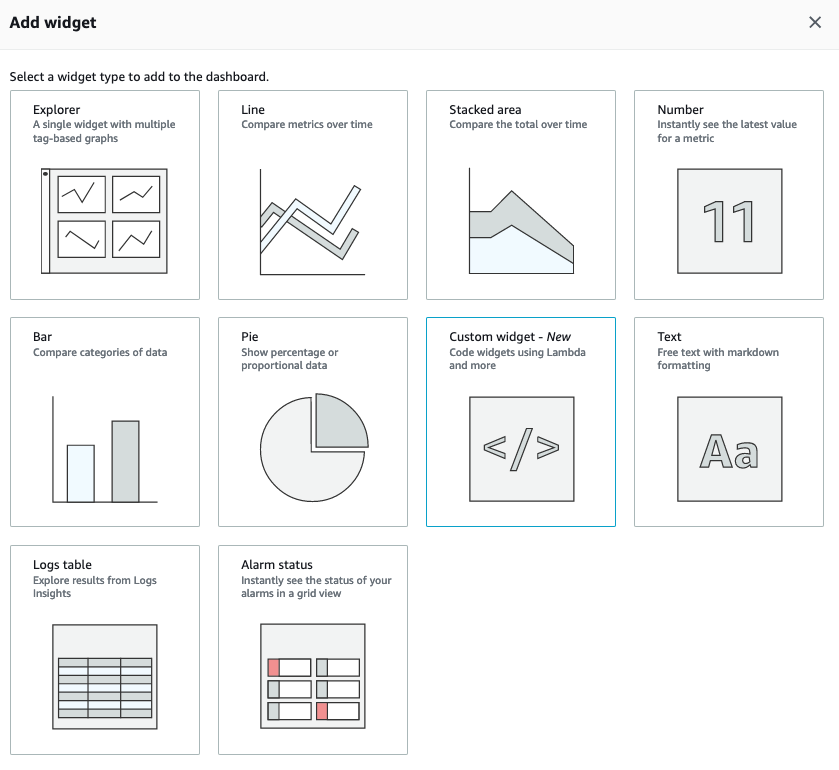
Answer: Proactive Monitoring using Amazon CloudWatch
- Metrics tell you what is happening (CPU, latency, errors)
- Logs tell you why it is happening
- Alarms notify you before things break
- Dashboards give a real-time system view
👉 Instead of reacting to user complaints, you:
- Detect anomalies early
- Automatically trigger scaling or recovery
- Maintain reliability and performance
This is the core idea behind observability in the cloud.
7.1.1 Services in CloudWatch:
- Metrics
- Alarms (when a metric goes above a threshold)
- Logs
7.1.2 Types of Cloudwatch Metrics
flowchart TD
  M((Metrics))
  M1((Default <br>AWS Service Metrics))
  M2((Custom<br>Application Metrics))

  EX1((Eg -<br>No of hits to a Service))
  EX2((Eg -<br>Website Load Times))

  M --> M1
  M --> M2

  M1 --> EX1
  M2 --> EX2
7.1.3 Types of Monitoring
- By default, with the AWS account, a
basic monitoringis enabled (where every 5 minutes some metrics reach the CloudWatch dashboard) - A
detailed monitoringat additional cost can be setup if say, metrics need to be logged every 1 minute instead of 5 minutes
7.1.4 How to filter/categorize Metrics
flowchart TD
  M((Metrics))

  M1((Dimensions))
  M2((Namespaces))

  EX1((Key/Value pair-<br>FunctionName/MyLambda))
  EX2((Metrics <br>belonging to<br>different categories-<br>aws/ec2,<br>aws/lambda))

  M --> M1 --> EX1
  M --> M2 --> EX2
- A
Dimensioncan be used to filter the metrics - A
Namespacegives a logical grouping of the logs into different categories
7.1.5 Custom Metrics
Using boto3 sdk, you can ensure custom metrics like the following that reflect the health of your application can be sent to CloudWatch logs
- Web page Load Time
- Amount of tasks handled
7.2 Other Services in CloudWatch
7.2.1 Understand the CloudWatch Dashboards
- For viewing aggregated statistics of CloudWatch metrics
7.2.2 CloudWatch Logs
- For lambda, easy to setup: Enable in IAM policy
- For EC2, enable CW logs agent
7.2 CloudWatch Alarms
- When a metric goes above a threshold, an alarm can be set
7.3 EventBridge
- For a Rule-triggered workflow
- Allows you to define rules that filter events based on specific patterns and forward those events to one or more targets.
7.4 Quick Recap
- Amazon CloudWatch Widgets are used to view and analyze metrics in CloudWatch Dashboard
The 3 states of a metric alarm in CloudWatch:
OK(metric is within the defined threshold),Alarm(metric is outside the defined threshold),Insufficient_data(metric does not have enough data to decide on the alarm)
VPC Network traffic (what network comes in and out of the VPC) can be measured by VPC Flow Logs
By default, Lambda functions run in a
Lambda-managed VPC that has internet access.- So one need not configure a VPC, Subenets and Security Group
- Unless they want to have their lambda accessed from inside a VPC in their own account.
- In that case, you can add a VPC configuration to a lambda function.
- This restricts the lambda function to resources within that VPC, unless the VPC has internet access
- So one need not configure a VPC, Subenets and Security Group